Use Python to Generate Protein Contact Map of Molecular Dynamics

Protein contact map is a very helpfull tool to represent 3D protein structure in a 2D matrix format. More detail about contact map can be found here. Contact maps can not only be used as illustrations of protein, but also as tools to predict homology protein structure, especially for low homolog in evolution. Some scientists have already applied deep learning on this project and developed programs for structure prediction, such as RaptorX of TTIC.

There are several tools or program for calculate and display contact map on internet, here is an collection of them. I had a project several month ago, and I wanted to use a script to generate contact maps for a molecular dynamic trajectory, so that I use python to write a script to do it. I love python because I could always find usefull packages from internet. Here I found a package named MDtraj, And a package from Benjamin Rafferty (doi:10.4231/D35M62761)! Thanks to them, I can simply achieve my idea.

Calculate electro shape of moleculars

I used a protein folding trajectory from internet. I will add the internet address after I update this blog next time. 😛

1
2
3
4
5
6
7
8
9
import mdtraj as md
import numpy as np
from __future__ import print_function
import matplotlib
from matplotlib.backends.backend_agg import FigureCanvasAgg as FigureCanvas
from matplotlib.figure import Figure
# Enviroment variable
XTC = './frame0.xtc'
PDB = './start.pdb'

I use gromacs format here because Gromacs is an advaced and open software of molecular dynamics, although MDtraj supports plenty of trajectory formats.

1
2
3
traj = md.load(XTC, top = PDB)
print('Frames: %d Atoms: %d Dimentions: %d\n' % traj.xyz.shape)
print('Time steps: %d ps' % (traj.time[1] - traj.time[0])) # pico second
1
2
Frames: 401  Atoms: 287  Dimentions: 3
Time steps: 50 ps

It is pretty convient to use MDtraj select residues and atoms.
hape Similarity and Electroshape Similarity Calculation

1
2
3
4
5
6
7
8
9
topology = traj.topology
print('MD imformation: %s\n' % topology)
print('All residues: %s\n' %
[residue for residue in traj.topology.residues])
# Select the sidechain of first residue in structure
selection = topology.select("(resid %d) and sidechain" % 0)
print('The sidechian coordinates of first residue:\n')
for i in traj.xyz[0, selection, :]:
print(i)
1
2
3
4
5
6
7
MD imformation: <mdtraj.Topology with 1 chains, 35 residues, 287 atoms, 290 bonds>
All residues: [LEU1, SER2, ASP3, GLU4, ASP5, PHE6, LYS7, ALA8, VAL9, PHE10, GLY11, MET12, THR13, ARG14, SER15, ALA16, PHE17, ALA18, ASN19, LEU20, PRO21, LEU22, TRP23, LEU24, GLN25, GLN26, HIS27, LEU28, LEU29, LYS30, GLU31, LYS32, GLY33, LEU34, PHE35]
The sidechian coordinates of first residue:
[ 1.26600003 3.65800023 3.81700015]
[ 1.34200001 3.78400016 3.85400009]
[ 1.24800003 3.85200024 3.95600009]
[ 1.47600007 3.76400018 3.91900015]

Function to Calculate Cotact Map

Below are functions for contact map calculation. I modified source code obtained from: https://nanohub.org/resources/contactmaps

1
2
3
4
5
6
7
8
9
10
11
12
13
14
15
16
17
18
19
20
21
22
23
24
25
26
27
28
29
30
31
32
33
34
35
36
37
38
39
40
41
42
43
44
45
46
47
48
49
50
51
52
53
54
55
56
57
58
59
60
61
62
63
64
65
66
67
68
69
70
71
72
73
74
75
76
77
78
79
80
81
82
83
84
85
86
87
88
89
90
91
92
93
94
95
96
97
def calc_residue_dist(residues = (0, 0)):
"""
Return the C-alpha distance between two residues.
"""
diff_vector = residues[0] - residues[1]
return np.sqrt(np.vdot(diff_vector, diff_vector))

def calc_side_center_mass(topology, frame):
"""
Return approximate center of mass of each side chain.
COM od Glycine is approximated by the coordinate of its CA atom.
"""
scmass = []

for i in range(0, topology.n_residues):
selection = topology.select("(resid %d) and sidechain" % i)
if len(selection) < 1:
selection = topology.select("(resid %d) and (name CA)" % i)
mass = np.array([0.0, 0.0, 0.0])
for atom in selection:
mass += traj.xyz[frame, atom, :]
scmass.append(mass/len(selection))
return scmass
def calc_residue_side_dist(frame, residue_one, residue_two):
"""
Return the C-alpha distance between two residues.
"""
# Select first residue
selection1 = topology.select("(resid %d) and sidechain" % residue_one)
if len(selection1) < 1:
selection1 = topology.select("(resid %d) and (name CA)" % residue_one)
# Select second residue
selection2 = topology.select("(resid %d) and sidechain" % residue_two)
if len(selection2) < 1:
selection2 = topology.select("(resid %d) and (name CA)" % residue_two)

return min( map(calc_residue_dist, [(x,y) for x in traj.xyz[frame, selection1, :] \
for y in traj.xyz[frame, selection2, :]]) )
def calc_matrix_cm(trj, frame, threshold = 0.8, distance = 1.2):
"""
Used internally to compute the matrix data when the object is
initialized.
"""
selection = trj.topology.select('name CA')
scmass = calc_side_center_mass(trj.topology, frame)
dim = len(selection)

matrix = np.zeros((len(selection), len(selection)))#, np.bool)
for row, atom1 in enumerate(selection):
for col, atom2 in enumerate(selection):
# Only calculate once
if col > row - 1:
continue

# the atom pointprint(traj.xyz[0, atom, :])
val = calc_residue_dist(residues = (traj.xyz[frame, atom1, :], traj.xyz[frame, atom2, :]))
# Center of mass

dis = calc_residue_dist((scmass[col], scmass[row]))

matrix[row, col] = val < threshold

if dis < distance:
matrix[col, row] = 1 - dis/distance
else:
matrix[col, row] = 0

return matrix

def calc_matrix_dis(trj, frame, threshold = 0.8, distance = (0.5, 1.2)):
"""
Used internally to compute the matrix data when the object is
initialized.
"""
selection = trj.topology.select('name CA')
scmass = calc_side_center_mass(trj.topology, frame)
dim = len(selection)

matrix = np.zeros((len(selection), len(selection)))#, np.bool)
for row, atom1 in enumerate(selection):
for col, atom2 in enumerate(selection):
# Only calculate once
if col > row - 1:
continue

# the atom pointprint(traj.xyz[0, atom, :])
val = calc_residue_dist(residues = (traj.xyz[frame, atom1, :], traj.xyz[frame, atom2, :]))
# closest distance of sidechains
dis = calc_residue_side_dist(frame, row, col)

matrix[row, col] = val < threshold

if dis < distance[0]:
matrix[col, row] = 1
elif distance[0] < dis < distance[1]:
matrix[col, row] = (distance[1] - dis)/(distance[1] - distance[0])
return matrix

Function for Output

Define functions for display and output of contact map. Also modified from https://nanohub.org/resources/contactmaps

1
2
3
4
5
6
7
8
9
10
11
12
13
14
15
16
17
18
19
20
21
22
23
24
25
26
27
28
29
30
31
32
33
34
35
36
37
38
39
40
41
def draw(matrix, fig=None, cmap = 'binary', interpolation = 'nearest', colorbar = True, contour = False):
"""
Creates a matplotlib figure representing the map's matrix. An existing
figure can be provided to be drawn on, otherwise a new figure will be
created.
"""
if not fig: fig = Figure()
ax = fig.add_subplot(111)
cax = ax.imshow(matrix, cmap = matplotlib.cm.get_cmap(cmap), \
interpolation = interpolation, origin="lower")
#ax.set_title(self.title)
#ax.set_xlabel(self.xlabel)
#ax.set_ylabel(self.ylabel)
if colorbar:
cbar = fig.colorbar(cax, cmap = matplotlib.cm.get_cmap(cmap))
# cbar.ax.set_ylabel(self.colorbarlabel)
if contour:
ax.contour(matrix, cmap = matplotlib.cm.get_cmap(cmap))
return fig

def show(matrix):
"""
Use pyplot to display the map in an interactive window. Will block
until the window is closed.
"""
import matplotlib.pyplot as plt
draw(matrix, fig = plt.figure())
plt.show()


def print_figure(matrix, filename="map.png"):
"""
Generates a plot of the map's data and saves an image at the given
filename.
"""
canvas = FigureCanvas(draw(matrix))
canvas.print_figure(filename)

def print_csv(matrix, filename="map.csv"):
np.savetxt(filename, matrix, delimiter = ',')
print('Saved matrix as file %s' % filename)

Generate conact maps for a trajectroy

1
2
3
4
5
6
7
8
9
10
11
12
for i in range(0, 400, 40):
'Output one contact map per 40 ns from a 400 ns trjactory'
name = 'dist-map-%dns.png' % (i * 0.05)
matrix = calc_matrix_dis(trj = traj, frame = i)
show(matrix = matrix)
print_figure(matrix, filename = name)

if i > 0: continue
matrix = calc_matrix_cm(trj = traj, frame = i)
show(matrix = matrix)
print_figure(matrix, filename="cm-map.png")
print_csv(matrix)

400ns Contact Map

Conclusion

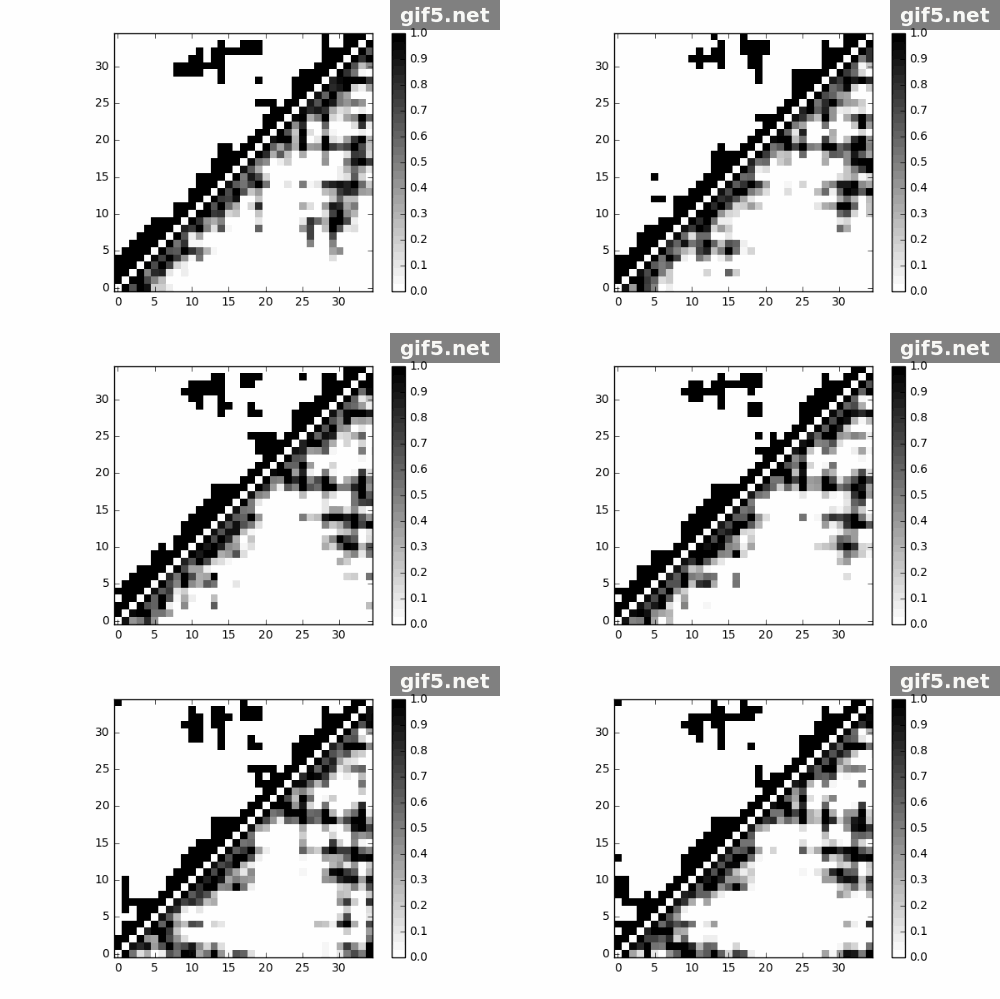
Finally, I generate a Gif picture for 11 frames of protein trajectory. The script could also generate matrix data of contact map, what can we do to that? ;P

References

[1] McGibbon, Robert T., et al. “MDTraj: A modern open library for the analysis of molecular dynamics trajectories.” Biophysical journal 109.8 (2015): 1528-1532.

[2] Benjamin Rafferty; Zachary Carl Flohr; Ashlie Martini (2014), “Protein Contact Maps,” https://nanohub.org/resources/contactmaps. (DOI: 10.4231/D35M62761).